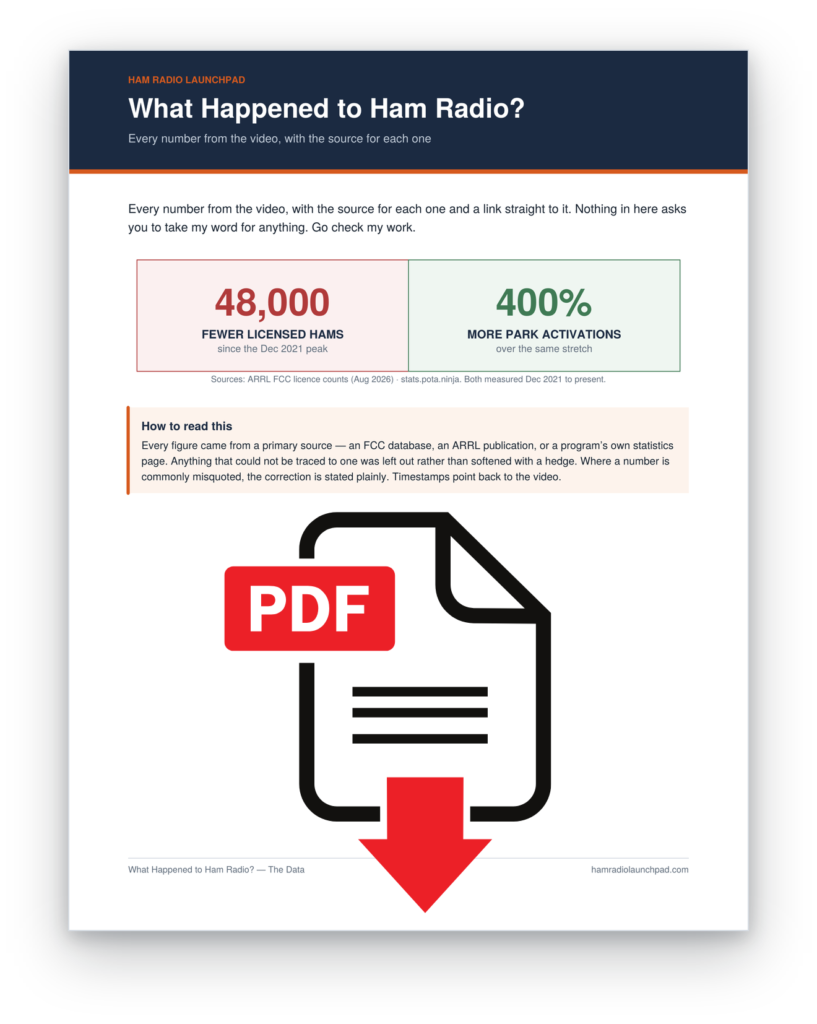
Thirteen pages of the data behind the “What Happened to Ham Radio?” video — the FCC license data, ARRL counts, POTA’s own dashboard, Field Day results. Links straight to each one. Nothing in here asks you to take my word for anything.
- The license count by class, showing where the loss is actually concentrated
- New application figures from the FCC’s own database, with both baselines and why the choice matters
- POTA growth measured correctly — activations and activators are different numbers, and they get swapped constantly
- Three widely-quoted figures I left out on purpose, and what’s wrong with each
*Figures collated July–August 2026.